Supply Crunch: Global Energy Crisis
Share article


In this blog, we examine global crude oil inventories, leveraging Ursa Space’s satellite-derived measurements of storage tanks.
The three graphs below shed light on the supply-demand balance in the oil market:
1. Global Crude Inventories
Where are global crude inventories in 2021 versus recent historical averages? Is the surplus that formed during 2020 gone?
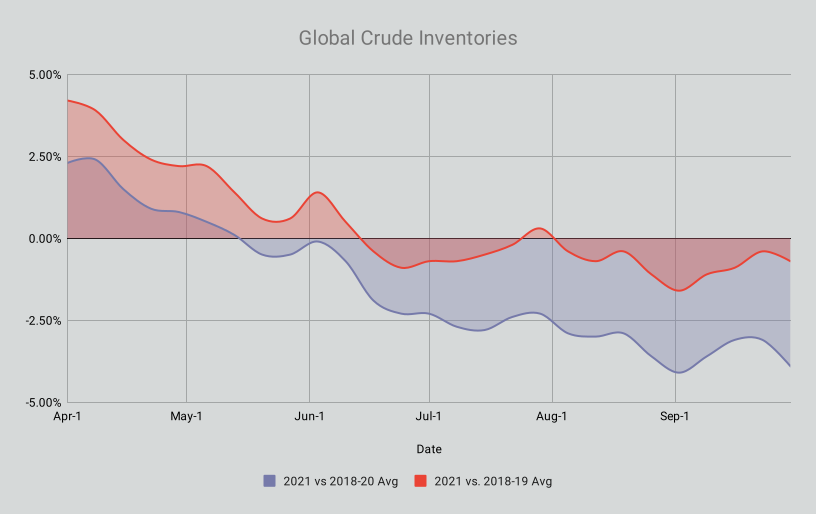
The graph above plots global crude inventories from April 2021 to the end of September versus the average of the same time period in 2018-20 (blue) and 2018-19 (red).
This comparison shows where current levels stand versus recent historical averages. Crude oil inventories in 2020 were unusually high, so it’s also helpful to look at the data without 2020 for a better gauge of “normal.”
In April 2021, crude inventories were still above recent historical levels, but that surplus evaporated by May/June, a significant turning point for the oil market.
Since then, inventories have remained below recent historical levels, although the deficit hasn’t grown. From this perspective, oil market fundamentals look fairly balanced, yet oil prices have surged.
The global oil benchmark has increased 50% this year, trading at its highest level since October 2018.
2. OECD vs Non-OECD
Is there any difference in crude inventory trends between Organization for Economic Co-operation and Development (OECD) members and countries outside the OECD?
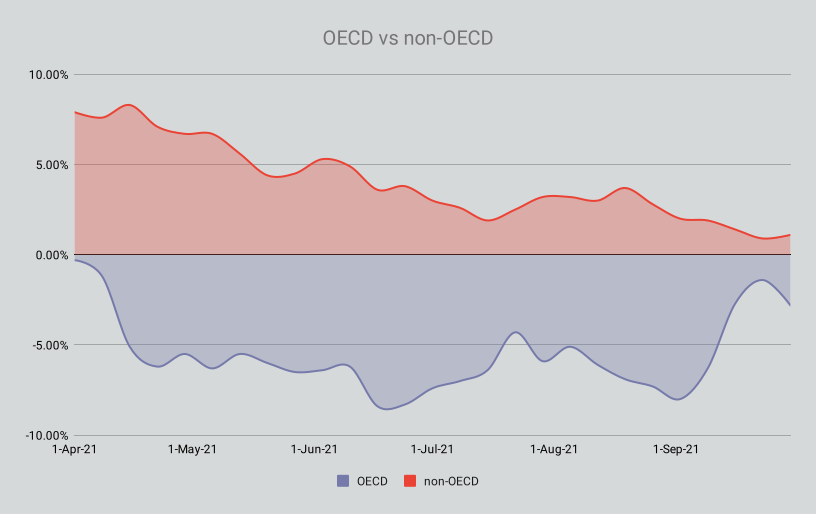
The graph above plots crude inventories from April 2021 to the end of September against the average of the same time period in 2018-19. The blue line represents only OECD members and the red line represents other countries.
In both cases, crude inventories have been falling, though there is a clear difference between the two.
By April 2021, OECD inventories already wiped out the surplus vis-a-vis historical levels, and then fell deeper into a deficit. Countries outside the OECD hadn’t yet erased the surplus at this point in time, but a few months later, the surplus was nearly gone.
3. Cushing vs Dalian vs Rotterdam
What is the state of crude oil inventories at some of the world’s largest, most strategic storage locations?
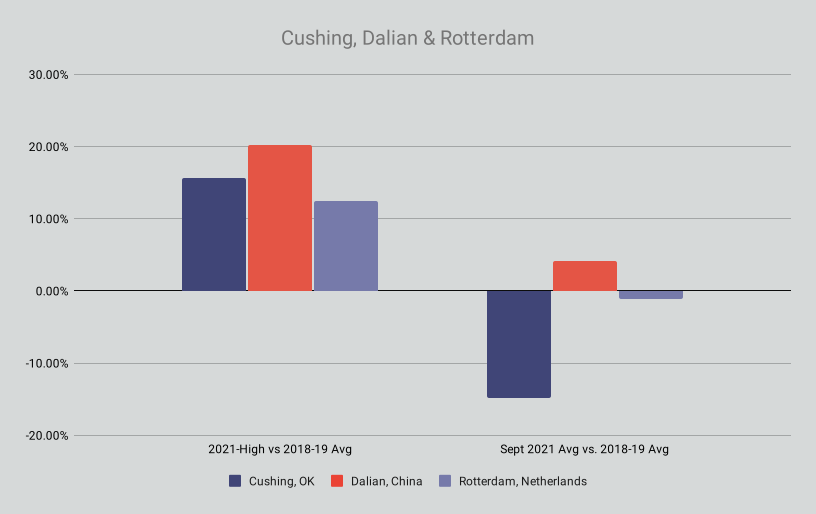
A look at three major oil storage locations underscores the trends described above involving OECD vs. non-OECD inventories.
The left columns show the high points in 2021 for each location as a percentage of its 2018-19 average. Inventories were high for all three locations, more so at Dalian than Cushing or Rotterdam.
How have things changed since then? The right columns show September 2021 levels for each location as a percentage of its 2018-19 average. Cushing and Rotterdam swung into a deficit, similar to the broader OECD trend, while Dalian remained in a slight surplus, similar to the broader Non-OECD trend.
What does this say about crude oil market fundamentals?
Ursa Space data shows crude oil inventories returning to normal levels by spring 2021, and then settling into a balanced state.
Part of the reason is constrained supply, with OPEC & Russia continuing to withhold some supply from the market, but another likely factor has been a recovery in demand.
A balanced crude oil market should be a source of relief for the rest of the energy complex. It means that a sense of normalcy could return relatively soon.
Next up, we will examine another industry recently upended. Auto manufacturers have struggled this year due to parts shortages, such as semiconductors, the root cause of which also stems from COVID-19 disruptions that rippled across supply chains.
Stay tuned!
Share article
